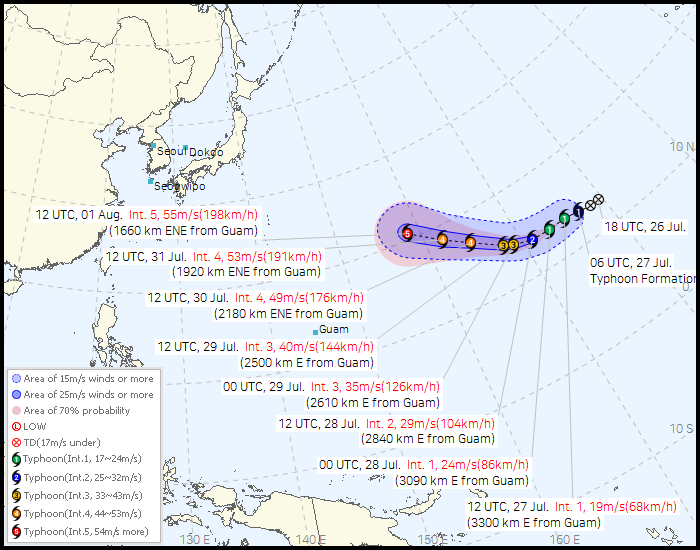


No.13 DOLPHIN KMA | : 月, 27 7 2026, 22:00(KST) 発表
| Date(UTC) | 強度 | 最大風速(m/s) | 中心気圧 (hPa) | 重心位置 | 移動方向 | 移動速度(km/h) | 15 m/s 半径(km) [例外半径] |
25 m/s 半径(km) [例外半径] |
70% 確率半径(km) | ||
|---|---|---|---|---|---|---|---|---|---|---|---|
| m/s | km/h | 緯度 (N) |
経度 (E) |
||||||||
| 7月 27日 12:00 分析 | 1 | 19 | 68 | 998 | 13.6 | 175.3 | W | 32 |
250 [SW 150] |
- | |
| 7月 28日 00:00 予想 | 1 | 24 | 86 | 990 | 13.5 | 173.3 | W | 18 |
270 [SW 170] |
40 | |
| 7月 28日 12:00 予想 | 2 | 29 | 104 | 980 | 13.6 | 171.0 | W | 21 |
290 [SW 190] |
50 [SW 30] |
80 |
| 7月 29日 00:00 予想 | 3 | 35 | 126 | 970 | 14.2 | 168.9 | WNW | 19 |
300 [SW 200] |
70 [SW 50] |
110 |
| 7月 29日 12:00 予想 | 3 | 40 | 144 | 955 | 14.7 | 167.9 | WNW | 10 |
300 [SW 200] |
90 [SW 60] |
130 |
| 7月 30日 12:00 予想 | 4 | 49 | 176 | 935 | 16.7 | 164.8 | NW | 17 |
320 [SW 220] |
100 [SW 70] |
190 |
| 7月 31日 12:00 予想 | 4 | 53 | 191 | 920 | 18.4 | 162.0 | WNW | 15 |
350 [SW 250] |
120 [SW 90] |
290 |
| 8月 1日 12:00 予想 | 5 | 55 | 198 | 915 | 20.7 | 158.5 | NW | 19 |
410 [SW 310] |
130 [SW 100] |
440 |