


Eathquake Trends
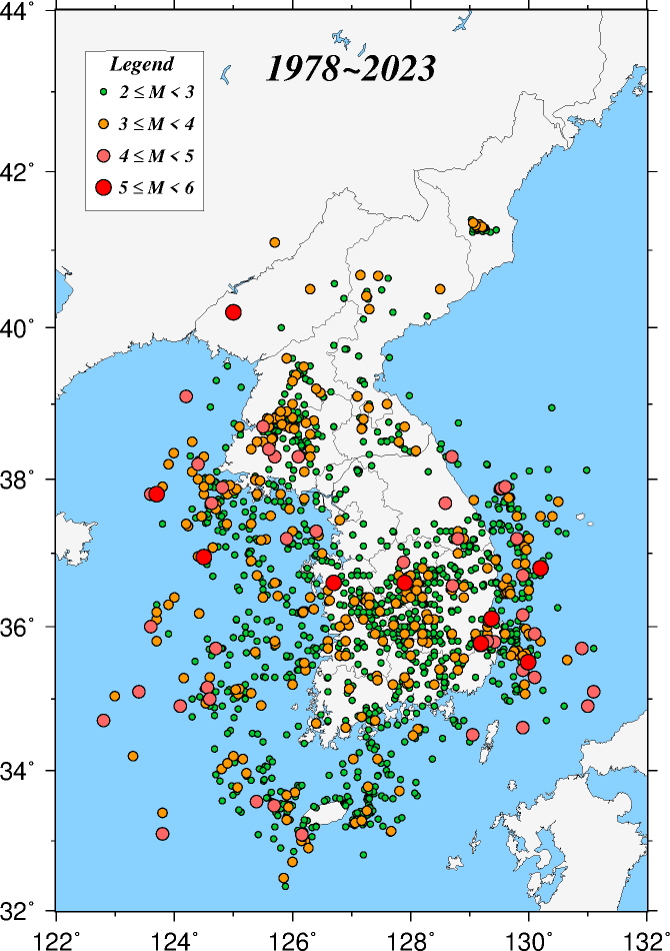
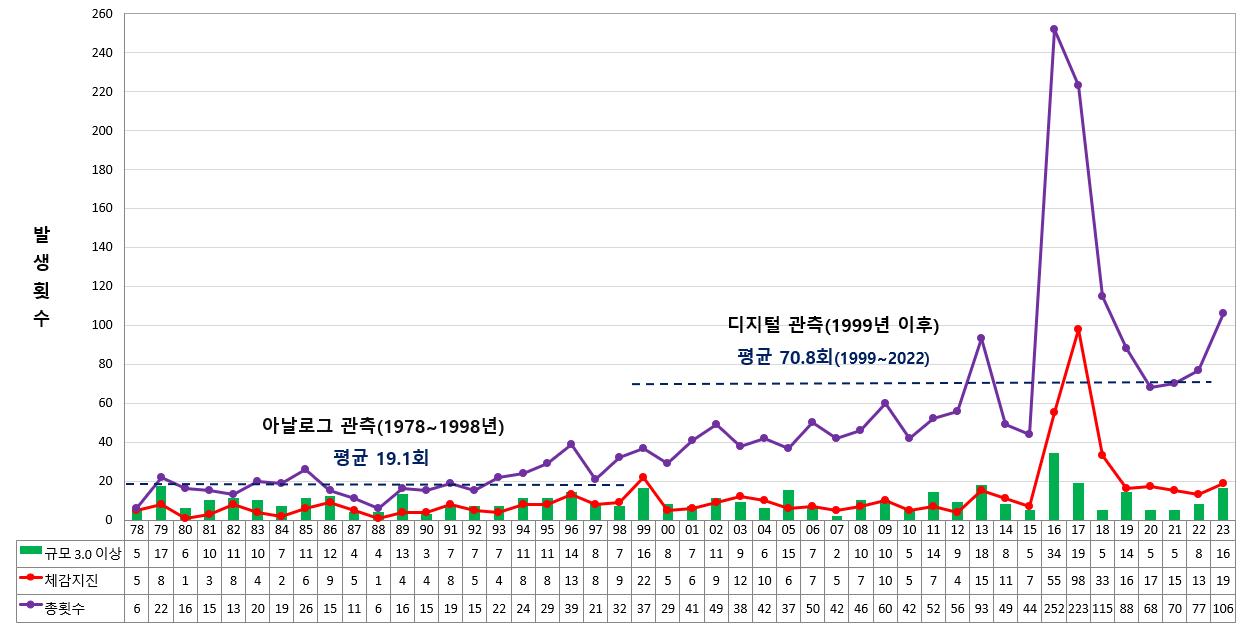
- Since 1978, when full scale seismic observation was first started, a total of 2,206 earthquakes have occurred in and around the vicinity of the Korean Peninsula(about 48 times per year) The earthquakes that magnitude is equal to or greater than 3.0, which is generally able to be sensed by ordinary people, have occurred about 10 times per year.
- In this period, the activity of earthquakes in Korea was relatively high from '78 to '82, rather quiescent from '83 to '91, and the trend has been active again from '92 to present.
Number of earthquakes
| Year | Magnitude 3 or higher | Number of earthquake detection | Total Number (Magnitude 2 or higher) |
|---|---|---|---|
| 1978 | 5 | 5 | 6 |
| 1979 | 17 | 8 | 22 |
| 1980 | 6 | 1 | 16 |
| 1981 | 10 | 3 | 15 |
| 1982 | 11 | 8 | 13 |
| 1983 | 10 | 4 | 20 |
| 1984 | 7 | 2 | 19 |
| 1985 | 11 | 6 | 26 |
| 1986 | 12 | 9 | 15 |
| 1987 | 4 | 5 | 11 |
| 1988 | 4 | 1 | 6 |
| 1989 | 13 | 4 | 16 |
| 1990 | 3 | 4 | 15 |
| 1991 | 7 | 8 | 19 |
| 1992 | 7 | 5 | 15 |
| 1993 | 7 | 4 | 22 |
| 1994 | 11 | 8 | 24 |
| 1995 | 11 | 8 | 29 |
| 1996 | 14 | 13 | 39 |
| 1997 | 8 | 8 | 21 |
| 1998 | 7 | 9 | 32 |
| 1999 | 16 | 22 | 37 |
| 2000 | 8 | 5 | 29 |
| 2001 | 7 | 6 | 41 |
| 2002 | 11 | 9 | 49 |
| 2003 | 9 | 12 | 38 |
| 2004 | 6 | 10 | 42 |
| 2005 | 15 | 6 | 37 |
| 2006 | 7 | 7 | 50 |
| 2007 | 2 | 5 | 42 |
| 2008 | 10 | 7 | 46 |
| 2009 | 10 | 10 | 60 |
| 2010 | 5 | 5 | 42 |
| 2011 | 14 | 7 | 52 |
| 2012 | 9 | 4 | 56 |
| 2013 | 18 | 15 | 93 |
| 2014 | 8 | 11 | 49 |
| 2015 | 5 | 7 | 44 |
| 2016 | 34 | 55 | 252 |
| 2017 | 19 | 98 | 223 |
| 2018 | 5 | 33 | 115 |
| 2019 | 14 | 16 | 88 |
| 2020 | 5 | 17 | 68 |
| 2021 | 5 | 15 | 70 |
| 2022 | 8 | 13 | 77 |
| 2023 | 16 | 18 | 105 |
Earthquake Status by Magnitude
| Year | 2.0≤M<3.0 | 3.0≤M<4.0 | 4.0≤M<5.0 | 5.0≤M | Total |
|---|---|---|---|---|---|
| 1978 | 1 | 1 | 2 | 2 | 6 |
| 1979 | 5 | 16 | 1 | 0 | 22 |
| 1980 | 10 | 5 | 0 | 1 | 16 |
| 1981 | 5 | 9 | 1 | 0 | 15 |
| 1982 | 2 | 8 | 3 | 0 | 13 |
| 1983 | 10 | 9 | 1 | 0 | 20 |
| 1984 | 12 | 7 | 0 | 0 | 19 |
| 1985 | 15 | 9 | 2 | 0 | 26 |
| 1986 | 3 | 12 | 0 | 0 | 15 |
| 1987 | 7 | 3 | 1 | 0 | 11 |
| 1988 | 2 | 4 | 0 | 0 | 6 |
| 1989 | 3 | 13 | 0 | 0 | 16 |
| 1990 | 12 | 3 | 0 | 0 | 15 |
| 1991 | 12 | 7 | 0 | 0 | 19 |
| 1992 | 8 | 4 | 3 | 0 | 15 |
| 1993 | 15 | 6 | 1 | 0 | 22 |
| 1994 | 13 | 7 | 4 | 0 | 24 |
| 1995 | 18 | 10 | 1 | 0 | 29 |
| 1996 | 25 | 12 | 2 | 0 | 39 |
| 1997 | 13 | 7 | 1 | 0 | 21 |
| 1998 | 25 | 6 | 1 | 0 | 32 |
| 1999 | 21 | 15 | 1 | 0 | 37 |
| 2000 | 21 | 8 | 0 | 0 | 29 |
| 2001 | 34 | 6 | 1 | 0 | 41 |
| 2002 | 38 | 10 | 1 | 0 | 49 |
| 2003 | 29 | 6 | 2 | 1 | 38 |
| 2004 | 36 | 5 | 0 | 1 | 42 |
| 2005 | 22 | 14 | 1 | 0 | 37 |
| 2006 | 43 | 7 | 0 | 0 | 50 |
| 2007 | 40 | 1 | 1 | 0 | 42 |
| 2008 | 36 | 9 | 1 | 0 | 46 |
| 2009 | 50 | 9 | 1 | 0 | 60 |
| 2010 | 37 | 5 | 0 | 0 | 42 |
| 2011 | 38 | 13 | 1 | 0 | 52 |
| 2012 | 47 | 9 | 0 | 0 | 56 |
| 2013 | 75 | 15 | 3 | 0 | 93 |
| 2014 | 41 | 7 | 0 | 1 | 49 |
| 2015 | 39 | 5 | 0 | 0 | 44 |
| 2016 | 218 | 30 | 1 | 3 | 252 |
| 2017 | 204 | 17 | 1 | 1 | 223 |
| 2018 | 110 | 4 | 1 | 0 | 115 |
| 2019 | 74 | 12 | 2 | 0 | 88 |
| 2020 | 63 | 5 | 0 | 0 | 68 |
| 2021 | 65 | 3 | 2 | 0 | 70 |
| 2022 | 69 | 7 | 1 | 0 | 77 |
| 2023 | 89 | 14 | 2 | 0 | 105 |