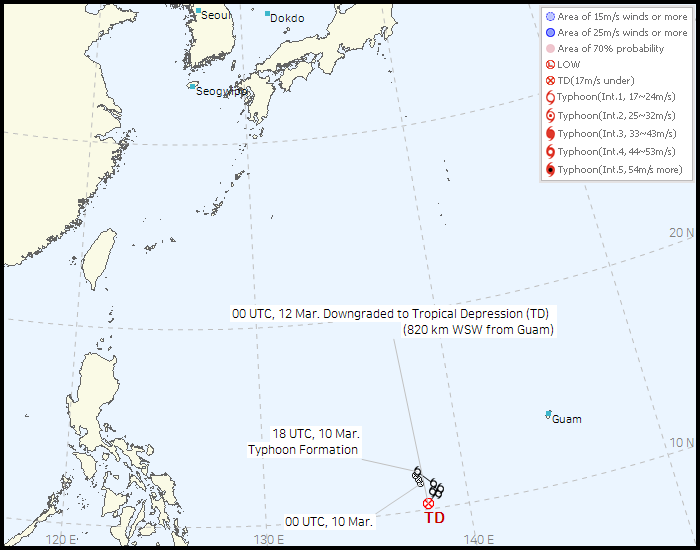
Go to Menu Go to Content

KMA

予想チャート

No.39 Tropical Depression KMA | Issued At: 木, 18 9 2025, 17:30
It is a table that allows you to check the tropical depression area forecast, the date and time of the tropical depression area, the central position (latitude, longitude), the central air pressure, the maximum wind speed (second, hour), the direction of travel, and the moving speed information.
Date(UTC) 強度 最大風速(m/s) 中心気圧 (hPa) 重心位置 移動方向 移動速度(km/h) 15 m/s 半径(km)
[例外半径]
25 m/s 半径(km)
[例外半径]
70% 確率半径(km)
m/s km/h 緯度
(N)
経度
(E)
9月 18日 06:00 分析 - TD 15 54 1008 23.2 164.3 NNW 11 -
9月 19日 06:00 予想 - 1 18 65 1002 23.7 159.9 W 19 170
[SW 70]
90
9月 20日 06:00 予想 - 1 21 76 994 24.9 155.0 WNW 21 200
[SW 100]
130
9月 21日 06:00 予想 Normal 2 27 97 985 26.7 151.5 WNW 17 240
[SW 140]
100
[SW 70]
190
9月 22日 06:00 予想 Normal 2 32 115 975 30.1 149.8 NNW 17 260
[SW 160]
120
[SW 90]
280
9月 23日 06:00 予想 Normal 2 32 115 975 32.4 151.4 NNE 12 260
[SW 160]
120
[SW 90]
410
No. 39 Tropical depression route